🚀Changelog

What's New

The latest updates and improvements to xplainable.

Feature

60% Faster Agent Workflow

The AutoTrain agent pipeline is now 60% faster, with smarter recommendations and real-time progress updates that let you go from dataset to deployed model in minutes.

Highlights

  • 60% faster pipeline execution through cross-phase pre-generation that eliminates wait times between steps
  • Smarter, label-aware recommendations for data preparation and feature engineering powered by automated data analysis
  • Real-time chart rendering as each visualization completes, no more waiting for all charts to finish
  • Skip what you don't need with a new option to bypass chart generation and jump straight to label selection

What Changed

The agent now pre-generates recommendations for the next step while you review the current one. Label suggestions load while you browse charts, data prep recommendations are ready the moment you select a target, and feature ideas appear instantly after data prep finishes.

Recommendations are now informed by your selected target variable, with correlation analysis, class balance detection, and skewness checks feeding directly into what the agent suggests. The result is fewer irrelevant steps and more impactful transformations.

Training is more resilient too. If a model fails to train, the agent automatically diagnoses the issue, adjusts the feature set, and retries without manual intervention. You also get a redesigned training approval screen with feature metadata so you can see exactly what goes into your model before it trains.

Feature

Deployment Error Tracking & Monitoring

Track and monitor inference errors across your deployments with status code breakdowns, real-time health summaries, and AI-powered diagnostics through MCP.

Highlights

  • Status code tracking for every inference prediction (200, 404, 422, 500)
  • Deployment health summaries available in a single query
  • Error monitoring through MCP for agentic workflows
  • Sparkline activity indicators on deployment cards

What Changed

Every inference prediction now records its HTTP status code, latency, and error details. You can see this breakdown directly on the deployment monitoring page as a stacked area chart showing successful and failed requests over time.

Deployment cards on the overview page now include a sparkline showing request volume over the last 24 hours, along with a request count and error count that turns red when failures are detected.

For teams using agentic workflows, new MCP tools let AI agents check deployment health and diagnose errors programmatically. A single call to the deployment health tool returns total requests, success rate, average latency, status code distribution, and recent error messages, giving agents everything they need to identify and report issues without manual dashboard checks.

Feature

New CLI for AI-Optimised API Access

xplainable-chat-client

Interact with xplainable directly from the terminal using the new xp command. Designed for both developers and AI agents like Claude and ChatGPT, the CLI delivers the same API coverage with dramatically lower token costs.

Highlights

  • New xp command with ~50 commands across all xplainable services: models, deployments, preprocessing, optimisation, and more
  • Purpose-built for AI agents: JSON output by default, structured exit codes, and clean separation of data and errors
  • Reduces AI agent token usage by up to 97% compared to MCP-based tool integrations
  • Zero new dependencies required

Why This Matters for AI Workflows

When AI agents like Claude or ChatGPT connect to APIs via MCP (Model Context Protocol), every tool schema is injected into the context window on every turn, whether used or not. With 47 tools, that is roughly 4,000 tokens per turn, adding up to 200,000+ tokens in a typical session.

The xp CLI flips this model. Because it runs as a standard shell command, it adds zero tokens to the context when idle and only a fraction when invoked. In a 50-turn session with 3 API calls, the CLI uses roughly 180 tokens of overhead versus 200,000 for the equivalent MCP setup.

Getting Started

Install or upgrade the client library, set your API key, and start using it:

python
Copied!
pip install --upgrade xplainable-client
export XPLAINABLE_API_KEY=xp_...
xp models list --pretty

The CLI supports --pretty for human-readable output and -q for minimal output, with compact JSON as the default for machine consumption.

Feature

Agentic Auto-Train: AI-Powered Model Building

xplainable-agentic-train

Introducing Agentic Auto-Train, a new AI-driven experience that intelligently analyzes your data, generates tailored visualizations, engineers features, and builds models with guided decision points at every step.

Highlights

  • Fully guided AI training pipeline that takes you from raw data to a deployed model with intelligent automation at every step
  • Smart data-aware visualizations that analyze your dataset and generate charts tailored to your actual columns and distributions
  • Interactive decision points where you stay in control of key choices like label selection, feature engineering, and deployment
  • Automated feature engineering that creates new features from your existing data to improve model performance
  • Built-in chat interface for querying your data, interpreting model results, and getting actionable predictions in natural language
  • One-click deployment, monitoring, and reporting to take your model from training to production in a single workflow

What's New

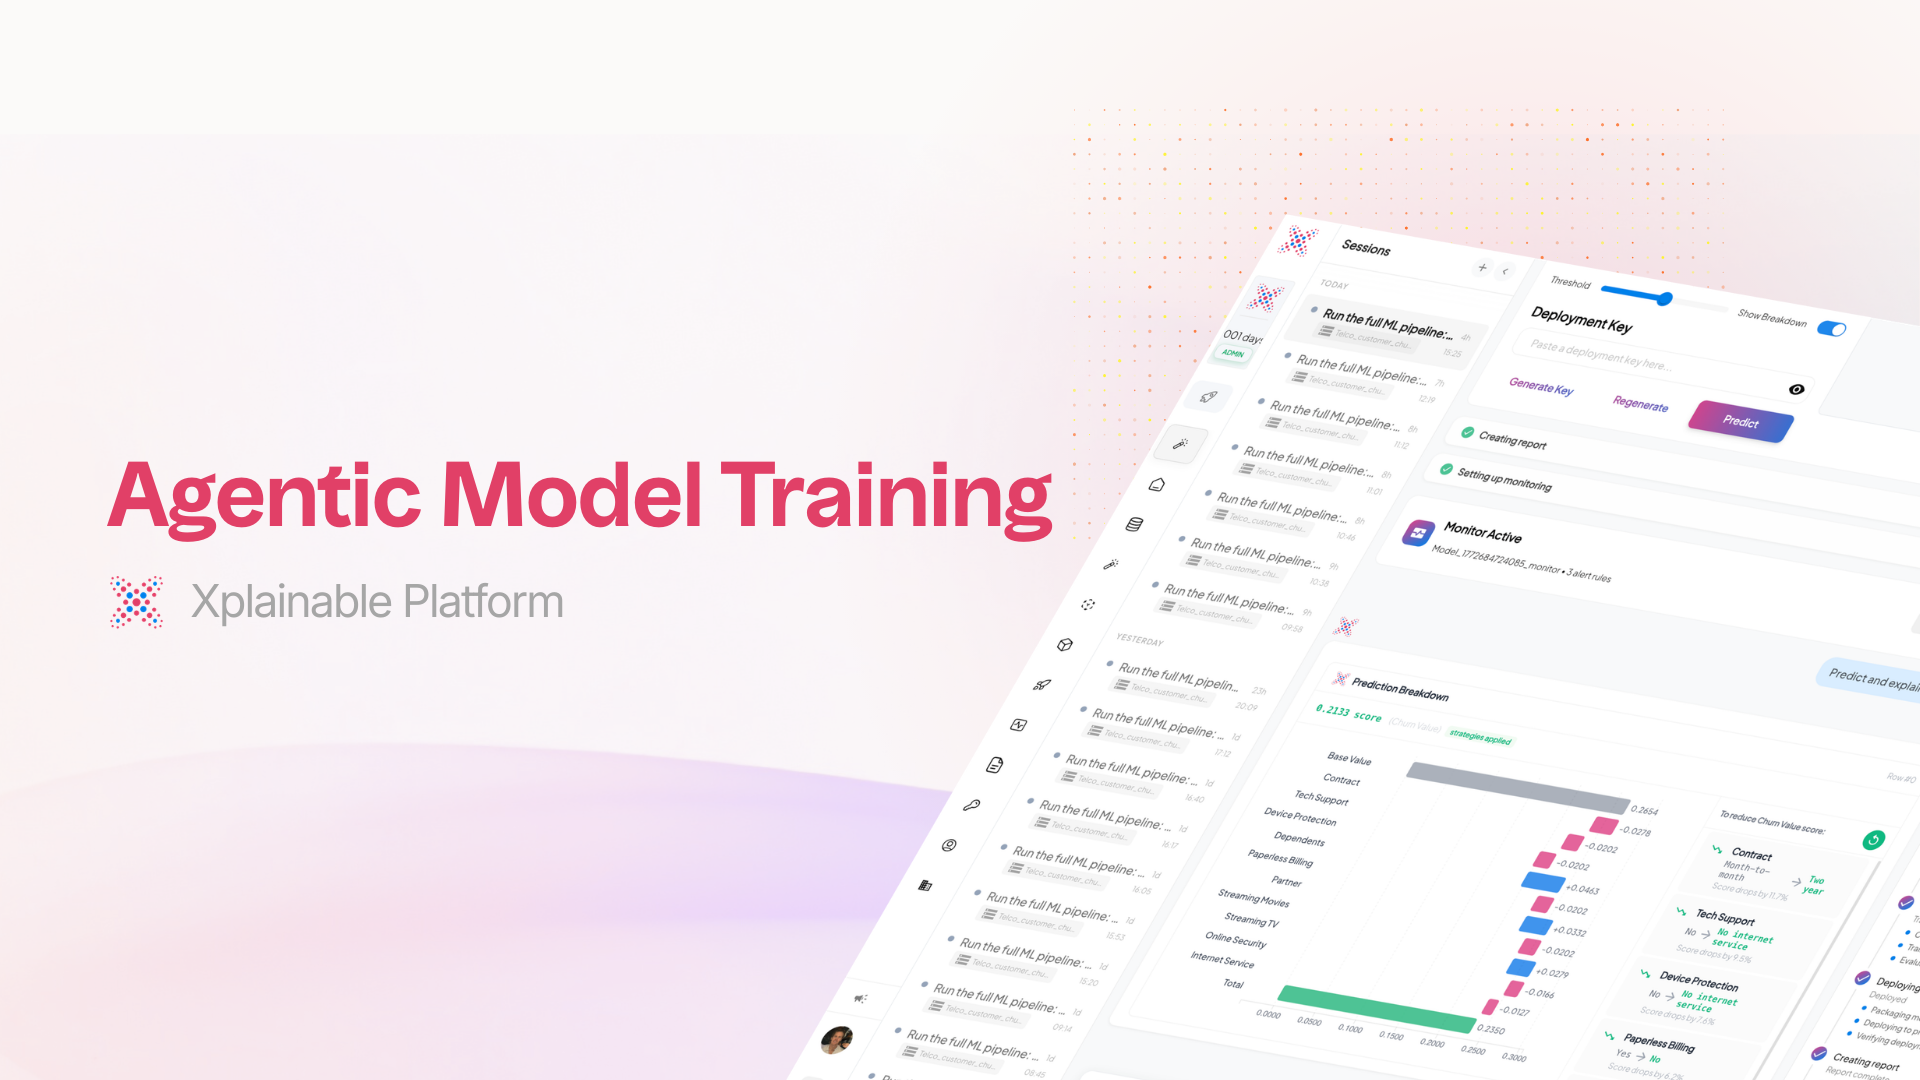
Agentic Auto-Train is a fundamentally new way to build machine learning models on xplainable. Rather than manually configuring each step of the pipeline, an AI assistant now guides you through the entire process from data upload to deployment. The system analyzes your dataset, makes intelligent recommendations, and adapts to your decisions at every stage.

Upload your data and the assistant immediately gets to work. It scans your dataset for quality issues, identifies column types, checks for missing values, and surfaces a health summary so you understand exactly what you're working with before training begins.

Intelligent Label Selection

The system analyzes every column in your dataset and recommends the most suitable prediction targets, ranked by confidence. Each recommendation comes with a clear explanation of why that column is a good candidate, along with key statistics like unique values, null rates, and class balance. You choose the label that fits your goal, and the pipeline adapts accordingly.

Data-Aware Visualizations

Instead of showing generic placeholder charts, the system now examines your dataset's structure and generates visualizations that are specific to your data. It identifies the most meaningful distributions, correlations, and feature relationships, then creates tailored charts that reference your actual column names and data characteristics. Each visualization comes with a title explaining what insight it's exploring and why it matters.

Automated Feature Engineering

The AI assistant reviews your dataset and generates new engineered features designed to improve model performance. It creates transformation code for each feature, explains the rationale behind each one, and presents them for your review. You can approve individual features, skip ones that don't make sense for your use case, or let the system apply its full set of recommendations.

Interactive Decision Points

Throughout the pipeline, you're presented with clear decision cards at every critical juncture. Whether it's selecting a prediction target, approving engineered features, reviewing preprocessing strategies, or confirming deployment settings, you always have visibility into what the AI is recommending and the ability to adjust course. The pipeline pauses at each decision point and waits for your input before continuing.

Comprehensive Model Overview

Once training is complete, you get a detailed model profile that goes beyond simple accuracy numbers. The overview includes performance metrics across multiple evaluation criteria, a breakdown of the top contributing features, and key insights about what the model learned from your data. You can see at a glance which features matter most and how the model is making its predictions.

Prediction Testing with Waterfall Breakdown

Test your model directly in the interface by entering values for each feature. The system returns a prediction along with a detailed waterfall chart showing exactly how each feature contributed to the result, both positively and negatively. Alongside the prediction, you get actionable recommendations highlighting which features have the most room for improvement and what direction would shift the outcome.

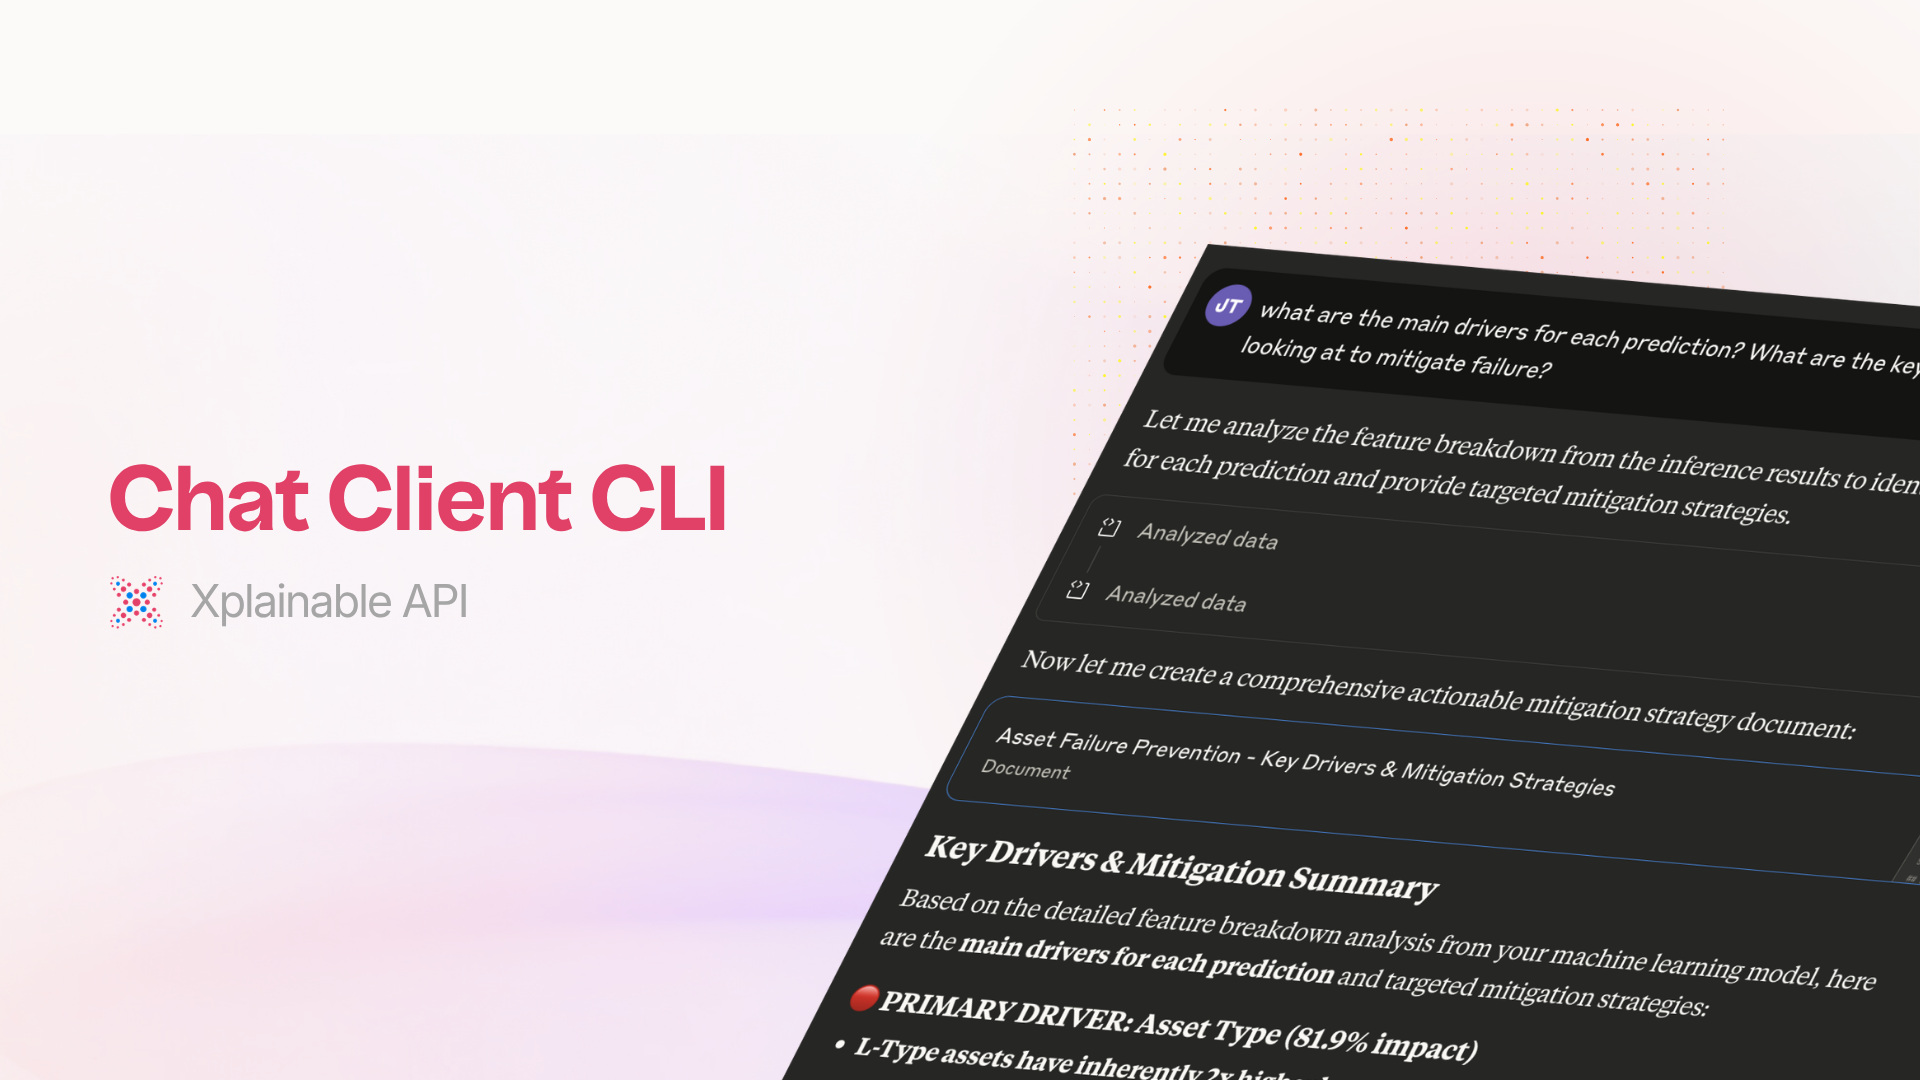
Chat with Your Data and Model

A built-in conversational interface lets you interact with your data and model using natural language. Ask questions about your dataset and get instant query results. Request new visualizations and they're generated on the fly. Ask the model to interpret its own behaviour or run what-if predictions. Responses stream in real time with rich formatting, inline charts, and structured data tables.

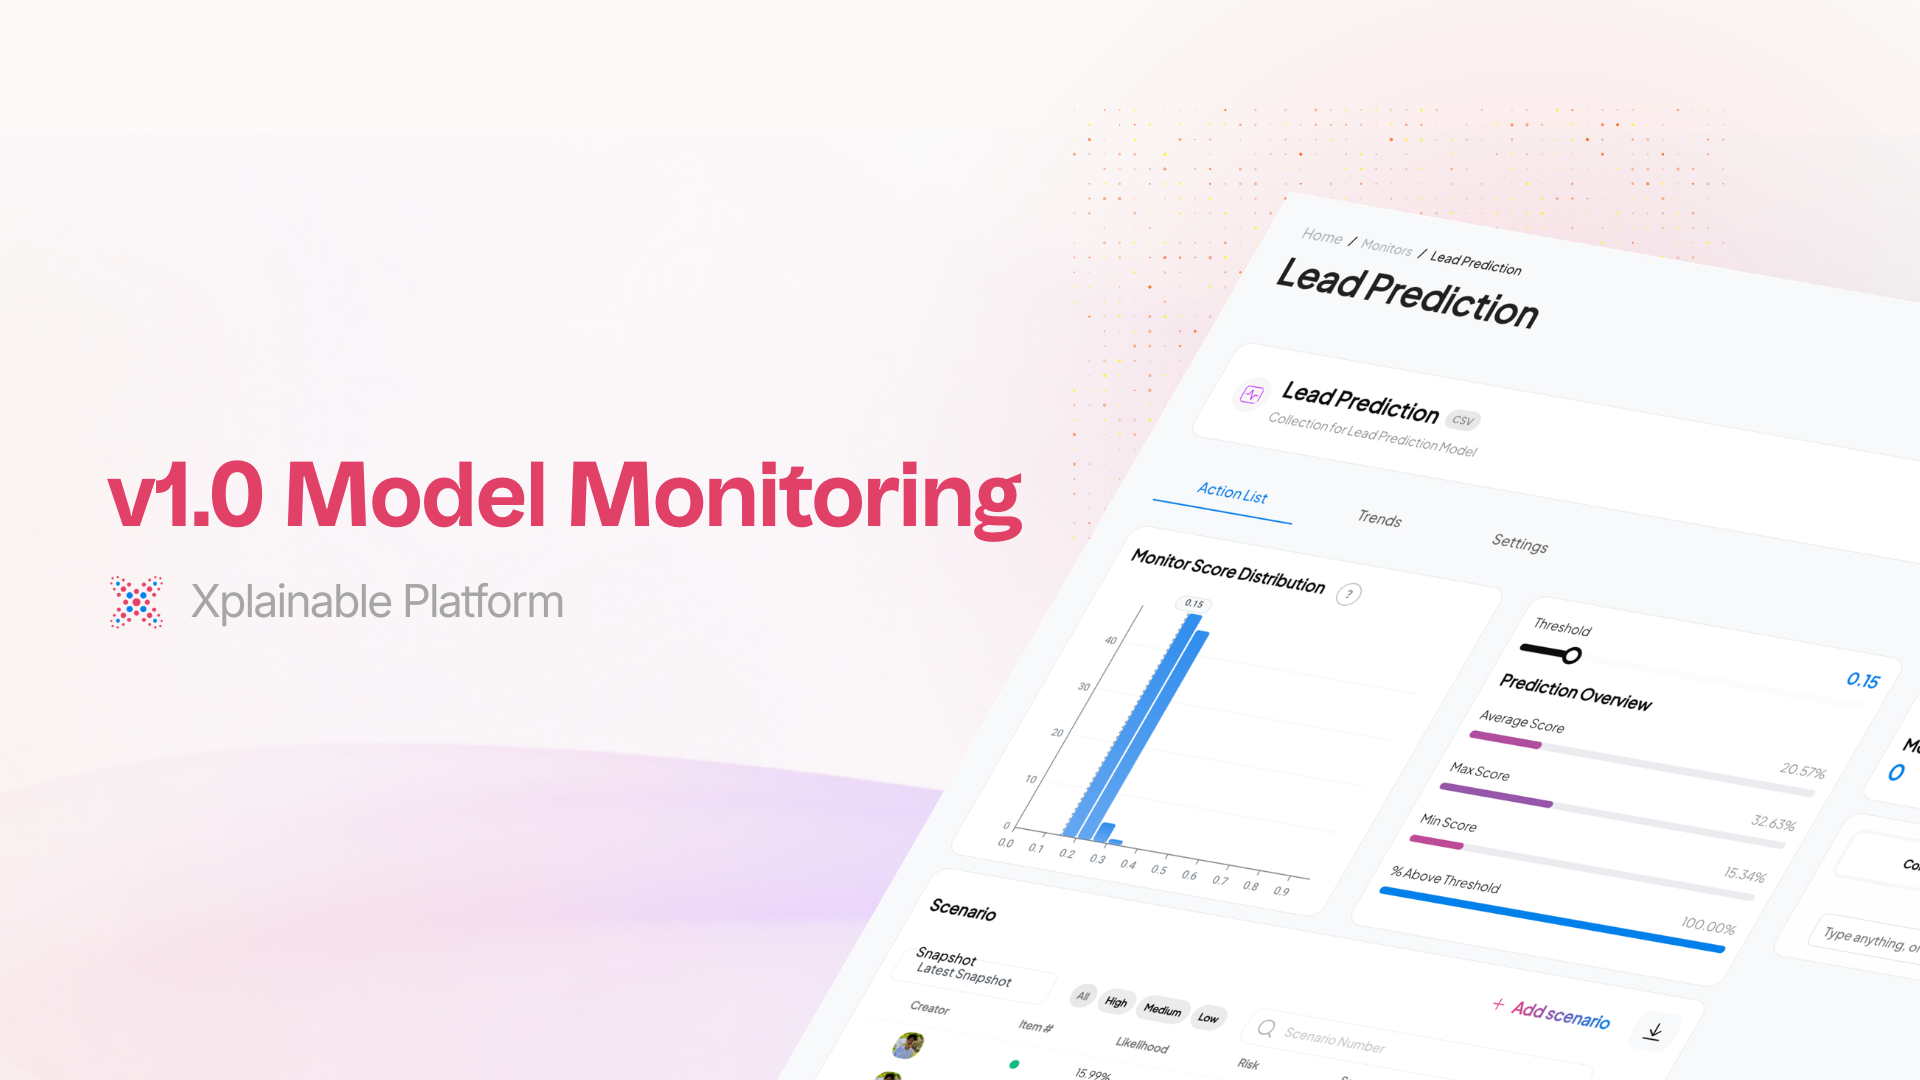
Deploy, Monitor, and Report

When you're satisfied with your model, deploy it with a single click directly from the training workflow. Set up automated monitoring to track model performance over time and catch drift early. Generate detailed reports summarizing your model's capabilities, training process, and key findings. The entire journey from raw data to production-ready model happens within one continuous, guided experience.

How It Works

  1. Upload your dataset and the AI assistant begins analyzing it immediately
  2. Review data health metrics and quality summaries
  3. Explore auto-generated visualizations tailored to your data
  4. Select a prediction target from ranked recommendations
  5. Approve engineered features and preprocessing strategies
  6. Train your model with optimized settings
  7. Evaluate performance with detailed metrics and feature breakdowns
  8. Chat with your model to test predictions and explore insights
  9. Deploy to production and set up monitoring, all in one flow
Featurev1.0.0

Model Monitoring, Redesigned

xplainable-model-monitoring

Monitor your deployed models with a completely redesigned experience featuring guided setup, direct data uploads, snapshot comparison, automated alerts, and a new operational health dashboard.

Highlights

  • Step-by-step monitor creation with a guided wizard that walks you through model selection, data upload, and configuration
  • Upload and run directly from the dashboard without needing to leave the monitor page or use external tools
  • Snapshot comparison to compare results across different runs and track how your model's predictions change over time
  • Automated alerts with email notifications using threshold, trend, and volume rules so you're notified when something needs attention
  • Operational health dashboard showing successful runs and triggered alerts at a glance
  • Plain language labels throughout, replacing technical jargon with terms like "Likelihood", "% Above Threshold", and "Item #"

What Changed

The Monitors section has been rebuilt to make it easier for anyone on your team to track model performance, not just data scientists. You can now create a new monitor in just a few steps using the creation wizard, which guides you through selecting a model, uploading your initial dataset, and reviewing your configuration before saving.

Once a monitor is set up, you can upload new data and trigger runs directly from the monitor page using the new "Upload and Run" button. A snapshot selector lets you switch between historical runs to see how predictions have shifted over time.

Alert rules let you define conditions that matter to your business. Set a threshold, track trends, or watch for volume spikes. When a rule triggers, you'll receive an email notification with the key details so you can take action quickly.

The monitors overview page now displays a timeline of run activity alongside cards showing your total successful runs and alerts triggered, giving you a clear picture of operational health across all your monitors.

We've also improved how empty states are displayed so new monitors look clean before their first run.

📬Stay updated
Sign up for our newsletter and get the latest news and insights on Explainable AI straight to your inbox.
Or, share with your network
Authors' Note
Hi there! We co-founded xplainable to provide greater transparency in AI systems and to simplify the world of machine learning and AI for everyone. If you're interested in discussing xplainable with us, please feel free the get in touch - we'd love to chat.