
💡Explore use cases
Xplainable Use Case List
These are aimed at providing short examples of how xplainable can be used.
Jump to
1. Healthcare
Healthcare
Patient Risk Prediction for Better Outcomes
Use Xplainable to predict patient risk and show exactly why each patient is high or low risk. Clinicians see ranked drivers (e.g., vitals, labs, encounter history) per patient, plus population-level feature effects, so triage actions are defensible and auditable. Scenario tools let care teams test "what if" changes—such as improved adherence or earlier review—and see the projected impact before acting. Deploy models to API or batch with approvals, versioning and shareable clinician-friendly reports. (Xplainable is decision-support only and does not replace clinical judgement.)

Example
ICU Critical Illness Prediction
Real-time prediction of acute critical illnesses including sepsis, acute kidney injury, and acute lung injury using explainable deep learning models trained on electronic health records. SHAP values reveal which clinical features (lab values, vital signs, medications) contribute most to each patient's risk score, enabling proactive interventions.

Example
Preventable Hospitalization Forecasting
Population-based prediction system that identifies patients with chronic conditions (diabetes, COPD, cardiovascular disease) at high risk of preventable hospitalizations. Explainable models show how factors like medication adherence, recent lab results, and social determinants of health influence risk, allowing care teams to target preventive interventions.
Finance
Predictive Fraud Detection for Customer Protection
Detect fraud in real time with model explanations your risk teams—and regulators—can trust. Xplainable highlights which signals (merchant profile, velocity, device, geography, amount) pushed a transaction over the action threshold, with consistent per-event reasoning and global policy views. Operations can tune thresholds and simulate policy changes safely using scenario optimisation, reducing false positives without sacrificing capture rates. Audit trails, version pinning and API deployment make compliance reviews straightforward.

Example
Real-Time Payment Fraud Detection
Machine learning system achieving 95.4% accuracy in detecting fraudulent transactions in real-time. LIME explanations reveal that key features like transaction amount, account balance changes, transaction type, and time patterns influence fraud classification. Investigators can understand why each transaction was flagged and take appropriate action.

Example
Financial Statement Fraud Analysis
Ensemble model analyzing financial statement data to predict corporate fraud with explainable Shapley values. The system provides both local explanations (why a specific company is flagged as fraudulent) and global explanations (overall model confidence patterns), helping auditors and regulators identify suspicious patterns in financial reporting.
Retail
Informed Customer Churn Analysis for Boosted Loyalty
Predict who will churn and why, then design interventions you can justify. Xplainable ranks churn drivers for every customer—tenure, delivery experience, returns, service interactions, basket mix—and shows uplift from targeted offers before you spend. Run cohort-level scenarios to optimise discounts, outreach timing and channels under budget constraints. Share interactive reports with CX, Marketing and Finance so everyone sees the same, transparent rationale.

Example
E-Commerce Churn Prevention System
Integrated analytics framework combining churn prediction with interpretability, temporal risk modeling, and behavior-based segmentation. TreeSHAP highlights tenure, complaint history, distance to warehouse, and cashback as key churn drivers, enabling retailers to prioritize high-risk customer groups and time retention campaigns for maximum impact.

Example
Retail Banking Customer Retention
Interpretable machine learning model transparently predicting customer churn likelihood and causes in retail banking. Deep clustering techniques applied to customer transaction data improve actionable decision-making by revealing distinct customer segments with different churn triggers, allowing for personalized retention strategies.
Manufacturing
Predictive Equipment Failure Detection for Improved Efficiency
Anticipate failures with sensor-driven models that explain the root causes, not just the alert. Xplainable surfaces which readings (vibration bands, temperatures, pressures, cycle counts) are driving risk for each asset and shift, so maintenance plans are precise and defensible. Use scenario analysis to choose the best maintenance window under throughput constraints, then deploy the model to stream or batch for shop-floor integration. Shareable reports make reliability insights accessible to engineering and operations.

Example
Industrial IoT Predictive Maintenance
Real-time monitoring system using IoT sensors on production machinery to capture performance data. Machine learning algorithms with LIME explanations interpret sensor readings to predict equipment failures, showing maintenance teams exactly which parameters (vibration, temperature, pressure) indicate upcoming malfunctions and enabling targeted preventive maintenance.

Example
Manufacturing Quality Control AI
Computer vision and deep learning system inspecting welding robots and production line equipment. Explainable models analyze images and videos to detect quality issues and predict tool failures, reducing inspection time by 70% while providing transparent explanations of defect classifications to quality engineers.
Transportation
Predictive Traffic Congestion Analysis for Improved Services
Forecast congestion across networks and explain the drivers behind each hotspot. Xplainable quantifies the contribution of weather, events, roadworks, school terms and adjacent links to predicted delays at specific times and locations. Planners can trial interventions—signal changes, detours, timetable tweaks—inside scenario tools to see expected network impact before rollout. Models deploy to APIs for real-time use, with versioned reports for stakeholders and the public.

Example
Urban Traffic Flow Optimization
AI system analyzing traffic patterns in major cities using SHAP and feature importance to identify which nearby roads, weather conditions, and temporal factors influence congestion. For example, predictions for Seoul's "Yeouinaru-ro" during rush hour reveal the top-k influential neighboring nodes, enabling traffic managers to implement targeted interventions.

Example
Public Transit Delay Prediction
Machine learning models using SHAP and LIME to predict delays in public transportation systems. Explainable predictions show how factors like weather, special events, time of day, and route conditions contribute to delays, allowing transit operators to proactively adjust schedules and inform passengers with transparent delay explanations.
Agriculture
Predictive Crop Yield Analysis for Improved Harvest
Project yields at field or block level and understand the agronomic levers that matter. Xplainable attributes predicted yield to factors like rainfall, soil characteristics, input rates, residue management and canopy metrics, per paddock and across seasons. Farmers and agronomists can simulate input changes and planting decisions under budget or sustainability constraints to find the best plan. Export transparent, shareable reports for growers, lenders and co-ops.
Example
Multi-Crop Yield Forecasting System
Hybrid model combining Random Forest, LSTM, and XGBoost with SHAP and LIME explanations, achieving R² = 0.98 on large-scale agricultural datasets spanning 33 states and 246,000+ records. The system shows farmers exactly how nitrogen application, crop residue management, rainfall patterns, and solar radiation affect yield, with impact sizes quantified in kg/ha.

Example
Precision Agriculture Remote Sensing
Interpretable ML framework using Sentinel-2 satellite imagery with XGBoost and SHAP values to predict crop yields. Temporal attention mechanisms highlight critical growth periods where weather conditions most strongly influence final yield, helping farmers time interventions like irrigation and fertilization for maximum effectiveness.
Energy
Predictive Electricity Demand Forecasting for Improved Reliability
Forecast load and explain the shape of demand with hour-by-hour drivers. Xplainable shows the contribution of temperature, tariffs, DER output, calendar effects and customer segments to each forecast, enabling confident operations and market bids. Test demand-response strategies in scenarios to balance reliability, cost and emissions, then deploy the winning policy to live APIs or batch schedules. Governance features ensure forecasts are versioned, auditable and easy to communicate.

Example
Smart Grid Load Forecasting
AI system using DeepLIFT and SHAP to explain energy demand predictions 24 hours in advance. The model shows grid operators which appliances, time periods, and weather conditions drive consumption peaks, enabling dynamic pricing that incentivizes off-peak usage and improves grid stability.

Example
Household Energy Monitoring
Explainable deep learning framework (ForecastExplainer) that maps energy consumption to specific household areas, appliances, and activities over time. Interactive visualizations help consumers understand their usage patterns and identify opportunities for energy savings, while utility companies can detect anomalies and forecast demand with high accuracy.
Insurance
Predictive Claim Analysis for Reduced Costs
Estimate claim probability and severity with transparent, per-policy reasoning. Xplainable makes it clear which attributes—driver history, asset characteristics, exposure, behaviours—move risk up or down so underwriters can price and triage confidently. Claims teams can run scenarios to evaluate routing rules and anti-fraud strategies before changing workflows. Shareable reports support model governance and regulatory reviews without black-box explanations.

Example
Auto Insurance Risk Assessment
XAI model explaining claim predictions by showing how vehicle area, driver age, driving record, and vehicle characteristics contribute to crash probability. Visual explainability techniques demonstrate analytical determinations at each stage, achieving 29% efficiency improvements while building customer and regulator trust through transparent risk scoring.

Example
Health Insurance Claim Prediction
XGBoost and Random Forest models with SHAP and LIME explanations predicting individual medical costs based on age, BMI, smoking status, children, and region. The system achieved high accuracy while providing interpretable feature importance rankings, helping underwriters understand which factors drive premium calculations and enabling personalized policy recommendations.
Telecommunications
Predictive Network Congestion Analysis for Improved Performance
Predict congestion across cells and routes, with line-of-sight into the drivers behind each predicted spike. Xplainable attributes risk to usage patterns, device mix, mobility, content types and time-of-day, enabling proactive capacity moves. Use scenario optimisation to test throttling policies, cache placement or temporary spectrum reallocation under SLA constraints, then deploy via API for NOC automation. Transparent reports keep engineering and product aligned.

Example
Data Center Traffic Engineering
Machine learning system dynamically allocating bandwidth in inter-data center networks, achieving 30% improved utilization. While based on complex algorithms, transparency efforts focus on auditable decision logs and performance metrics that network engineers can interpret to understand traffic management choices.

Example
5G Network Resource Management
AI-driven network slicing that predicts congestion and dynamically manages resources to guarantee high-priority access during peak usage. The system balances real-time data feeds like body cameras and vehicle telemetry for first responders, with explainability frameworks helping operators understand resource allocation decisions.
Food and Beverage
Predictive Food Safety Analysis for Improved Quality
Identify contamination and quality risks with traceable model logic from plant to pallet. Xplainable links predictions to batch metadata, sensor readings, lab tests and supplier history, showing exactly why a lot is flagged and what action reduces risk. Scenario tools help QA teams choose the lowest-cost effective intervention (hold, rework, targeted test) under compliance rules. Share concise, audit-ready reports with operations and regulators.

Example
Pathogen Detection and Monitoring
XGBoost and Random Forest models using Raman spectroscopy and electronic nose sensors to detect bacterial contamination (E. coli, Salmonella) in real-time. SHAP values explain which spectral features or sensor readings indicate contamination risk, helping food safety inspectors understand detection decisions and trace contamination sources.

Example
Food Fraud and Import Risk Prediction
Machine learning system analyzing import-export data and inspection records to predict which food shipments are likely to fail safety inspections. Explainable AI tools (SHAP, LIME, WIT) reveal how producer characteristics, supply chain relationships, and network patterns influence risk scores, enabling targeted inspections and fraud prevention.
Sports
Predictive Athlete Injury Detection for Improved Performance
Spot elevated injury risk early and explain it in coach-friendly terms. Xplainable attributes risk to training load patterns, recovery metrics, biomechanics and schedule density for each athlete, so programmes can be adjusted with confidence. Test alternative taper plans or session mixes in scenarios to hit performance goals while controlling risk. Shareable dashboards align performance, medical and coaching staff on the same evidence.

Example
Multi-Sport Injury Risk Prediction
Explainable AI framework using Random Forests and CNN to predict injury risks across soccer, basketball, skiing, and running. The model clusters athletes into subgroups with different injury mechanisms and uses decision trees to show how training load, biomechanics, and recovery status contribute to risk, enabling coaches to design personalized prevention programs.

Example
Concussion and Post-Injury Monitoring
Machine learning system achieving 95% accuracy in predicting post-concussion musculoskeletal injury risk. CNNs estimate traumatic head injury severity (>90% accuracy for concussion prediction), while interpretable models track recovery metrics and identify when athletes are at elevated risk of secondary injuries, guiding return-to-play decisions.
Environmental Sciences
Predictive Air Quality Analysis for Improved Public Health
Forecast AQI and emissions drivers with transparent, location-specific explanations. Xplainable quantifies the impact of meteorology, traffic, industrial activity and topography on each forecast, supporting targeted interventions. Policy teams can simulate measures—e.g., corridor closures or time-of-day restrictions—and see projected health and compliance outcomes before implementation. Versioned reports make communication to agencies and the public clear and consistent.

Example
Urban Air Quality Forecasting
Machine learning system using SHAP analysis to predict air quality index and identify pollution sources. The model reveals which atmospheric conditions, traffic patterns, industrial emissions, and meteorological factors contribute most to pollution episodes, enabling city planners to implement targeted interventions and issue timely public health warnings.

Example
Environmental Health Risk Mapping
Real-time air quality assessment framework combining predictive modeling with SHAP-based interpretability to map health risks. The system identifies the most influential environmental and demographic variables (pollution sources, population density, vulnerable groups) behind each prediction, supporting evidence-based policy decisions and community health initiatives.
More from the blog
More from the blog
Insights·15
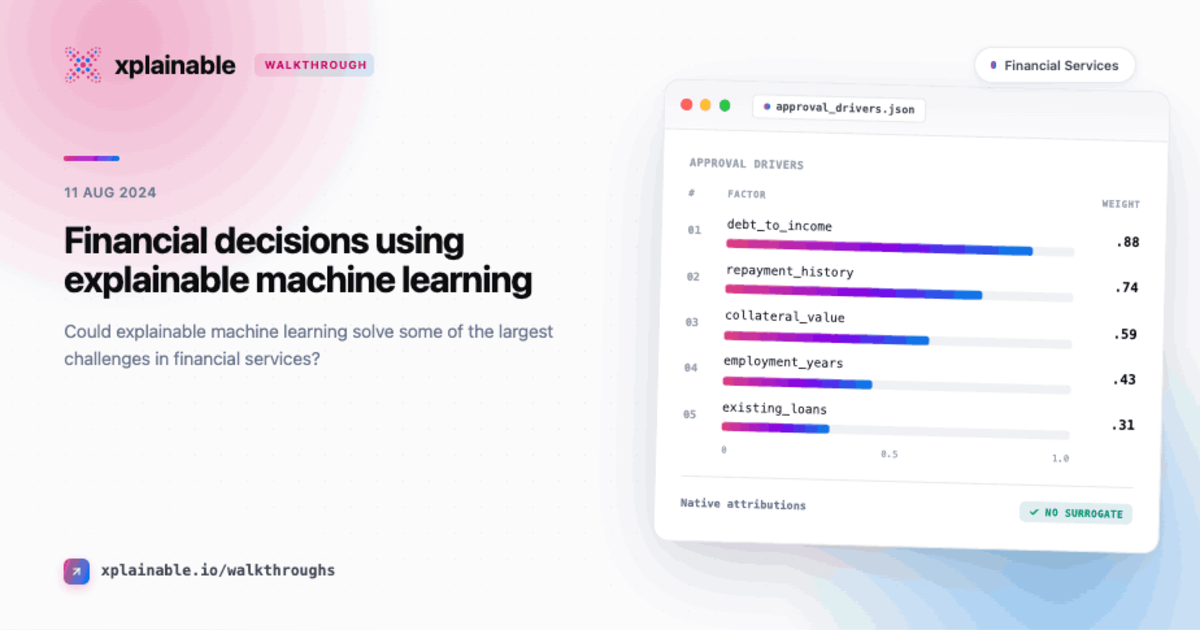
Financial Decisions using Explainable Machine Learning
Discover insights about insights and practical applications in this walkthrough.
Read more :·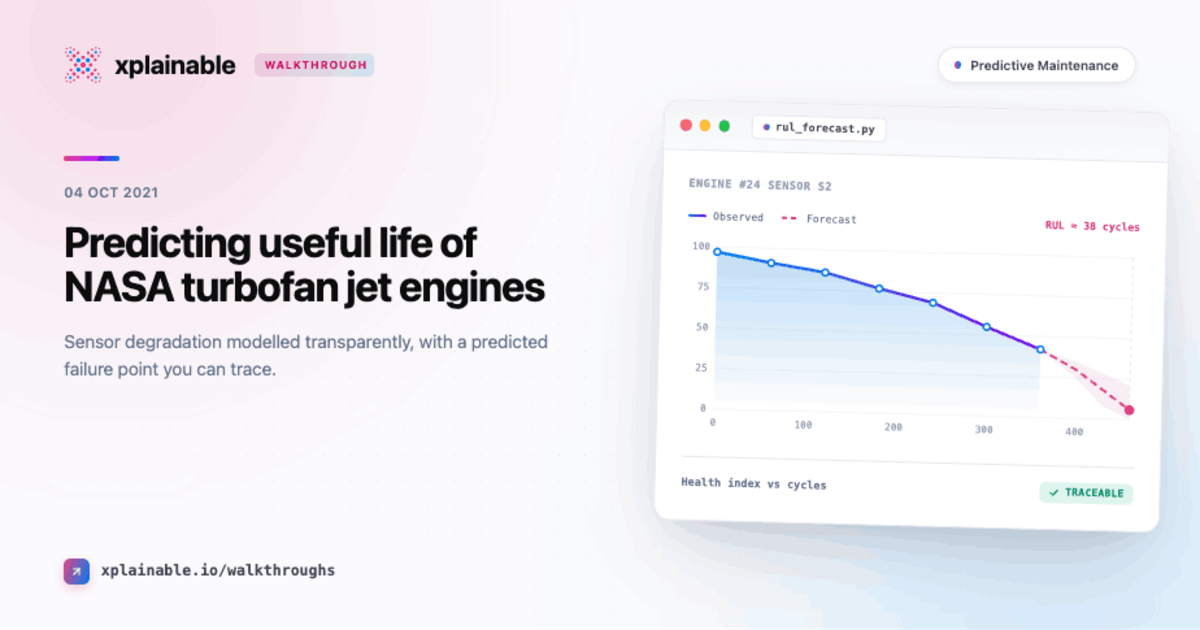
Insights·15
Predicting The Remaining Useful Life of NASA Turbofan Jet Engines
Discover insights about insights and practical applications in this walkthrough.
Read more :·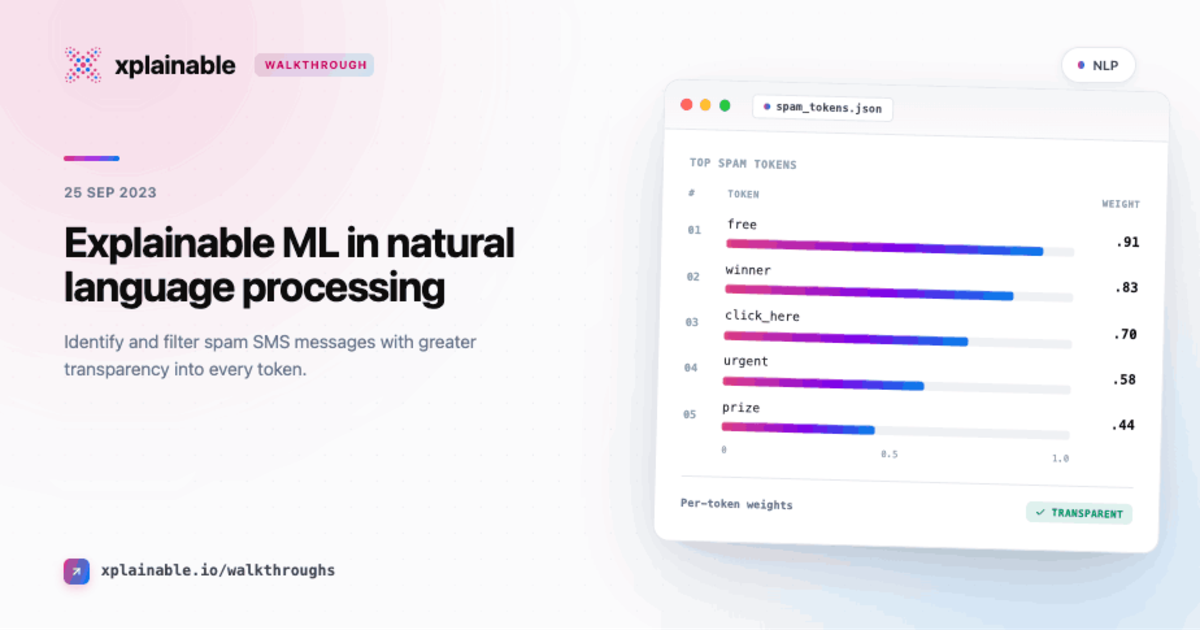
Insights·15
Uncovering the Power of Explainable Machine Learning in Natural Language Processing
Discover insights about insights and practical applications in this walkthrough.
Read more :·📬Stay updated
Sign up for our newsletter and get the latest news and insights on Explainable AI straight to your inbox.
Or, share with your network
Authors' Note
Hi there! We co-founded xplainable to provide greater transparency in AI systems and to simplify the world of machine learning and AI for everyone. If you're interested in discussing xplainable with us, please feel free the get in touch - we'd love to chat.
engine: online