Reducing Customer Churn with Explainable AI: Why Knowing Who Will Leave Isn't Enough
Move beyond black-box churn predictions. When your retention team understands why customers leave, they can take targeted action to keep them.

Your churn model flags 200 customers as high risk this month. Your retention team opens the list, sees 200 names and 200 scores, and faces the same question every time: now what?
Do they call all 200? Offer the same discount to everyone? Prioritize by score alone and hope for the best?
This is not a data problem. It is an action problem.
Customer churn costs U.S. businesses $136 billion annually. (source) When your churn model cannot tell you why customers are leaving, those losses become preventable tragedies.
Most churn prediction tools do one thing well: they identify who is likely to leave. But knowing who without knowing why leaves your retention team guessing. The real question is not "which customers are at risk?" It is "what can we do about it?"
That is the difference between churn prediction and churn prevention. And it is where explainable AI changes the game.
The Cost of Customer Churn: By the Numbers
Before exploring solutions, let us look at what is at stake:
The economics are clear: keeping customers is significantly more valuable than finding new ones. And with customer acquisition costs surging 222% over the last five years (source), the retention case grows stronger every year.
The Compounding Effect on Business Valuation
For SaaS businesses, churn does not just eat into revenue. It fundamentally changes what your company is worth.
Reducing churn by 5 percentage points can increase a SaaS company's enterprise value by 30-50% over five years. (source) Companies with churn above 10% see valuation multiples drop to 3-4x revenue, compared to 8-12x for low-churn businesses.
The Problem with Black-Box Churn Prediction
Machine learning models are remarkably good at predicting churn. Recent studies show accuracy rates of 93-96% (source) on benchmark datasets. But accuracy alone does not solve the retention problem.
1. Prediction without explanation is just an alert
When a model outputs "Customer #4721: 78% churn risk" and nothing else, it is no different from a fire alarm with no map to the exits. Your retention team knows there is a problem, but has no idea what to do about it.
A 2025 systematic review (source) found that while ensemble methods provide superior predictive accuracy, their opacity creates a critical gap: businesses can predict who will churn but cannot understand why.
2. Generic retention campaigns waste budget
Without understanding why individual customers are at risk, companies default to one-size-fits-all retention offers. The 10% discount email goes to everyone, regardless of whether the customer's issue is pricing, service quality, or a missing product feature.
This matters because the probability of selling to an existing customer is 60-70%, compared to just 5-20% for a new prospect (source). But that probability drops significantly when the retention approach does not address the customer's actual concerns.
3. Leadership cannot trust what they cannot see
When a churn model cannot explain its reasoning, executives are left to take its recommendations on faith. In regulated industries, this is not just uncomfortable, it is a compliance risk. The EU AI Act, with enforcement beginning in 2026, requires explainability mechanisms for AI-driven decisions.
From "Who Will Leave" to "Why They Leave"
This is where explainable AI fundamentally changes the approach. Instead of treating churn prediction as a binary classification problem (will they leave or not?), explainable models reveal the factors driving each customer's risk.
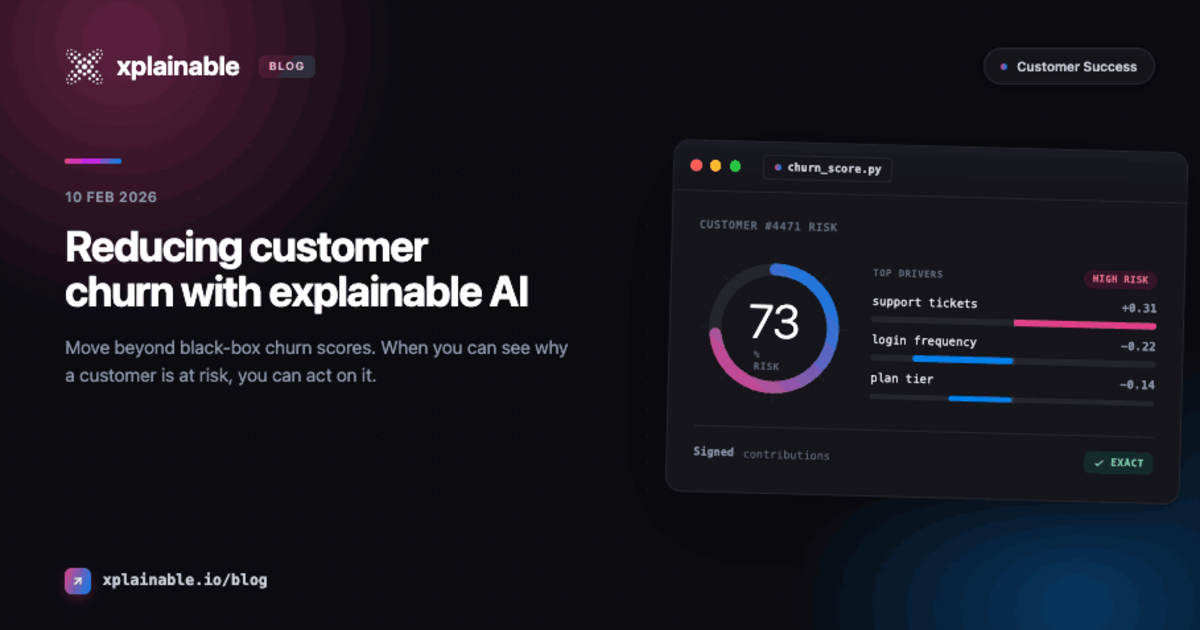
With xplainable, every churn prediction comes with a clear breakdown of what is contributing to the risk:
Your retention team does not just see "high risk." They see why the customer is at risk and, critically, which factors they can actually influence.
The Three-Level Explanation Advantage
Black-box models give you one thing: a risk score. xplainable gives you three levels of insight:
- Global explanations: What patterns drive churn across your entire customer base? Is it pricing? Contract type? Service quality?
- Regional explanations: How do different segments behave? Do enterprise customers churn for different reasons than SMBs? Do certain geographies have higher attrition?
- Local explanations: Why is this specific customer at risk? What are the unique factors driving their score?
This layered approach means your CMO can optimize retention strategy (global), regional managers can tailor their approach to local conditions (regional), and individual account managers can take targeted action for specific customers (local).
Understanding What You Can (and Cannot) Change
One of the most powerful concepts in explainable churn analysis is the distinction between contextual variables and levers.
Contextual variables are factors you cannot change. They describe who the customer is:
- How long they have been a customer (tenure)
- Their demographic characteristics
- Their location
- Their company size or industry
Levers are factors your team can directly influence:
- Contract type (can you incentivize a longer commitment?)
- Support tier (can you offer enhanced tech support?)
- Product features (can you bundle additional services?)
- Billing method (can you switch them to a more convenient payment option?)
Every customer has a story. Contextual variables tell you who they are. Levers tell you what you can do to keep them.
When your churn model separates these two categories, your retention team stops wasting time on factors they cannot influence and focuses entirely on the actions available to them.
Scenario Analysis: Testing Retention Strategies Before You Act
This is where explainable churn models become genuinely transformative. xplainable's scenario analysis lets your retention team ask: "What would reduce this customer's churn risk?"
Consider a real example from our churn analysis walkthrough, built on a dataset of 45,000+ telecommunications customers:
Customer Profile: High-Risk Individual- Tenure: 3 months (new customer, high risk)
- Contract: Month-to-month (high risk)
- Tech Support: None (high risk)
- Churn Score: 78% (very likely to leave)
You cannot change that they are a new customer. That is contextual. But you can pull levers:
- Offer tech support -> Churn score drops to 71% (7-point reduction)
- Offer a 1-year contract with discount -> Churn score drops to 58% (additional 13-point reduction)
- Bundle device protection -> Churn score drops to 52% (additional 6-point reduction)
By pulling three levers, the customer's churn probability drops from 78% to 52%. That is the difference between a customer who is almost certainly leaving and one who is more likely to stay.
A 26-point reduction in churn probability is not just a number. It is a customer retained, revenue protected, and a relationship preserved.
The scenario analysis tool lets teams experiment with different combinations to find the most cost-effective intervention before making a single phone call or sending a single offer.
Practical Applications by Team
For Retention Specialists:- Identify which retention offers will have the biggest impact for each customer
- Prioritize outreach based on both churn risk and the potential for intervention to succeed
- Track whether interventions actually reduced churn over time
- Understand which churn drivers are most prevalent in their area
- Tailor regional retention programs to address the specific issues affecting their customer base
- Allocate business development managers to underperforming regions with clear mandates
- See the key drivers of churn across the entire business, not just individual anecdotes
- Make data-backed decisions about which retention investments will deliver the highest ROI
- Demonstrate to the board that retention strategy is based on transparent, explainable analysis
The ROI Case for Explainable Churn Reduction
Let us quantify the impact:
But these numbers only hold when teams actually use the model's predictions. And adoption depends on trust.
A 2025 literature review (source) found that a model with moderate precision can produce strong ROI if interventions are well-targeted, while a highly accurate black-box model that triggers generic retention messages may deliver little measurable lift.
In other words, an explainable model that your team trusts and acts on will outperform a more accurate model that nobody uses.
What This Looks Like in Practice
We have built a detailed interactive walkthrough that demonstrates exactly how explainable churn analysis works, using a real dataset of 45,000+ telecommunications customers. It covers:
- Model performance metrics: How the model balances precision and recall
- Key churn drivers: Which factors matter most (and by how much)
- Interactive model profiles: Visual breakdowns of how every feature contributes to churn risk
- Scenario analysis in action: Real examples of testing retention strategies before implementation
- The contextual variables vs. levers framework: A practical approach to turning insights into action
The walkthrough is more technical in nature, but the visual tools and interactive elements make the concepts accessible to anyone interested in understanding how the analysis works under the hood.
Conclusion
Churn prediction is a solved problem. Models can identify at-risk customers with 93-96% accuracy (source). But prediction without explanation leaves your retention team exactly where they started: guessing.
Explainable AI changes the question from "who will leave?" to "why are they leaving, and what can we do about it?" With xplainable, your team gets:
- Clear visibility into the factors driving each customer's churn risk
- Actionable levers that separate what you can change from what you cannot
- Scenario analysis to test retention strategies before committing budget
- Three levels of insight for executives, managers, and frontline teams
- Compliance-ready transparency for regulated industries
The data is clear: a 5% improvement in retention can increase profits by 25-95% (source). But only if your retention strategy is targeted, transparent, and trusted.
Ready to see how it works with your customer data? Book a demo and we will show you exactly which levers will reduce churn for your business.