What Agentic Auto-Train Actually Does (And Why It's Different)
Most AutoML tools give you a model and a score. Agentic Auto-Train gives you a model you understand, built through a process you controlled.

There is a growing list of tools that promise to automate machine learning. Upload a dataset, click a button, get a model. The pitch is always the same: no expertise required.
The problem is not that these tools fail to produce models. They produce models just fine. The problem is what happens next.
You get a performance score. You get a model object you cannot inspect. You get a prediction endpoint with no explanation of how it works. And when your stakeholder asks "why did the model predict this?", you have nothing to offer except "the algorithm decided."
We built Agentic Auto-Train because we think the entire pipeline should be transparent, not just the final output. Here is what that actually looks like in practice.
The Problem with "Just Click Train"
Most no-code ML platforms abstract away complexity by hiding it. That works until it does not.
A 2025 analysis of no-code AutoML platforms found that model interpretability is one of the most significant limitations: businesses can build models but cannot understand why they make specific predictions. This is a compliance risk in any regulated industry, and a trust problem in every industry.
The standard AutoML approach treats the training pipeline as a black box with two openings: data goes in, model comes out. Everything in between, the feature engineering, the preprocessing decisions, the label selection, is handled silently.
This creates three problems:
- You cannot validate what you cannot see. If the model chose a preprocessing strategy that does not make sense for your domain, you will never know.
- You cannot explain what you do not understand. When a regulator or executive asks how the model works, "the AutoML tool handled it" is not an acceptable answer.
- You cannot improve what you did not participate in. The next iteration requires the same blind trust in the same automated decisions.
How Agentic Auto-Train Works
Agentic Auto-Train is an AI assistant that walks through the full training pipeline with you. It does the heavy lifting, but it stops at every meaningful decision and asks for your input.
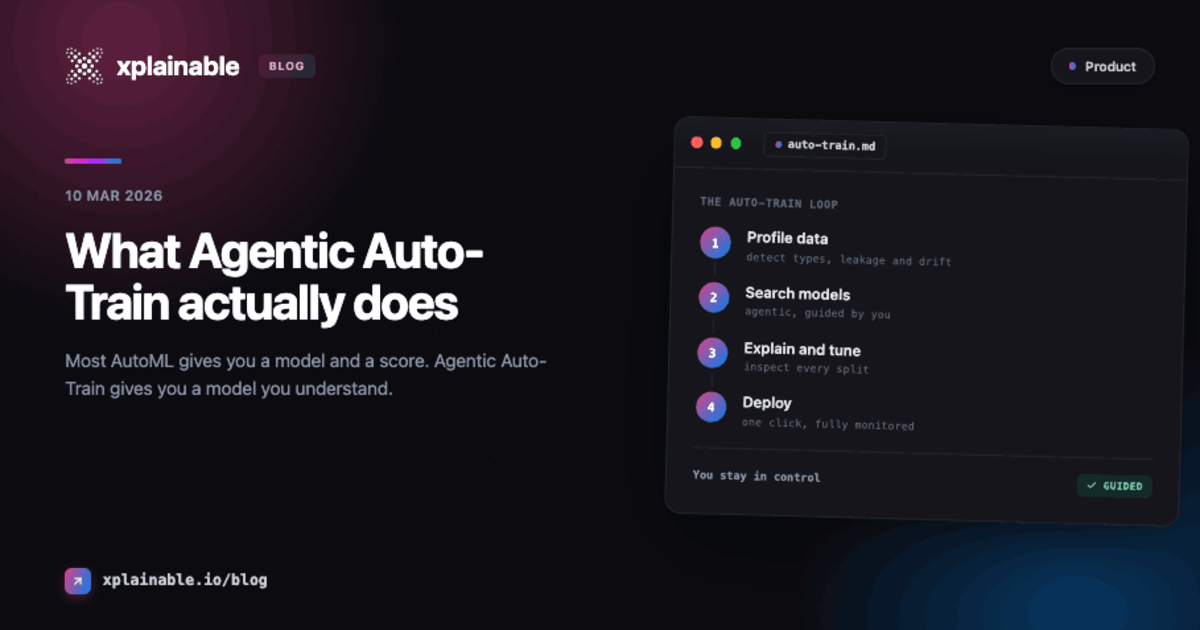
The process follows a clear sequence:
The key difference: at no point does the system make an irreversible decision without your knowledge. Every recommendation comes with a reason. Every step shows its work.
Visualizations That Actually Reflect Your Data
Most AutoML tools either skip visualization entirely or show the same five generic chart types regardless of the dataset. A histogram of the first numeric column. A correlation matrix. A bar chart of the target variable. The same output whether you uploaded customer transactions or sensor readings.
Agentic Auto-Train takes a different approach. Before generating any charts, the system analyzes your dataset's structure, column distributions, data types, and relationships. It then generates visualization goals that are specific to what is actually in your data.
If your dataset has a strong time dimension, you get time-series decompositions. If you have categorical features with interesting interactions, you get grouped comparisons. Each chart comes with a title explaining the question it is exploring and why that question matters for your particular dataset.
This is not cosmetic. Understanding your data before training is the most important step in the pipeline, and generic charts do not help you understand anything.
Feature Engineering You Can Read
Automated feature engineering is one of the most opaque parts of traditional AutoML. The tool generates 50 new features, selects 12, and gives you no visibility into what was created or why.
Agentic Auto-Train generates features and shows you the transformation code for each one. You can read the Python code, see the rationale, and decide feature by feature which ones to include.
This matters because feature engineering encodes assumptions about your domain. A feature that calculates "days since last purchase" assumes recency matters. A ratio of two financial columns assumes that relationship is meaningful. These are domain decisions, not just mathematical operations, and you should be able to see them.
Every Prediction Tells You Why
This is where xplainable's architecture makes a material difference.
Because the underlying model is inherently interpretable, every prediction includes a complete breakdown of feature contributions. Not a post-hoc approximation from SHAP or LIME that may or may not reflect the model's actual reasoning, but the real contributions built into the model's structure.
The prediction testing interface shows a waterfall chart for each prediction: which features pushed the score up, which pulled it down, and by how much. Alongside that, you get actionable recommendations identifying which input variables have the most room for improvement.
Harvard Data Science Review published research showing that interpretable models match the accuracy of black-box models in domain after domain: criminal justice, healthcare, computer vision. The belief that you must sacrifice accuracy for transparency is, in their words, "inaccurate." (source)
You do not need to choose between a model that performs well and a model you can explain. The entire point of xplainable's architecture is that these are the same model.
A Chat Interface That Does More Than Chat
After training, you get a conversational interface connected to both your dataset and your model. This is not a chatbot wrapper around a documentation page. It is a tool that can:
- Query your data and return structured results with actual row counts and aggregations
- Generate new visualizations on the fly based on questions you ask
- Interpret model behaviour by explaining how the model weighs different features
- Run what-if predictions by letting you change input values and see how the output shifts
Each response streams in real time with formatted tables, inline charts, and clear explanations. The goal is to let you explore your model and data without switching tools or writing code.
Deploy, Monitor, Report. Same Workflow.
The traditional AutoML pipeline ends at training. You get a model object and a performance score, and the rest is your problem.
Agentic Auto-Train continues through deployment, monitoring, and reporting:
- Deployment: One-click deployment directly from the training flow. No export, no separate deployment tool, no DevOps handoff.
- Monitoring: Connect to a live data source and the model runs predictions on new data automatically, with alerts when something shifts.
- Reports: Generate a structured summary of the model's performance, training process, and key findings for stakeholders who were not in the room when you built it.
All of this happens inside the same session. The context from training carries through to deployment and monitoring, so you do not lose information between steps.
What This Is Not
Agentic Auto-Train is not a replacement for data scientists who need full control over their modelling workflow. The Python SDK and notebook interface still exist for users who want to write code, tune parameters manually, and build custom pipelines.
What it does replace is the tedious, repetitive setup work that precedes the interesting parts of data science. The column type detection. The initial visualizations. The preprocessing boilerplate. The deployment configuration. It handles those steps intelligently while keeping you in the loop on the decisions that actually matter.
The Differentiation, Plainly
There are many tools that automate model training. Here is what makes this one different:
The pitch is not "no expertise required." The pitch is: your expertise matters, so the system gives you the information and control to apply it, while handling the parts that do not need your attention.
Ready to see it in action? Book a demo and bring a dataset. The best way to evaluate this is to watch it work on your own data.